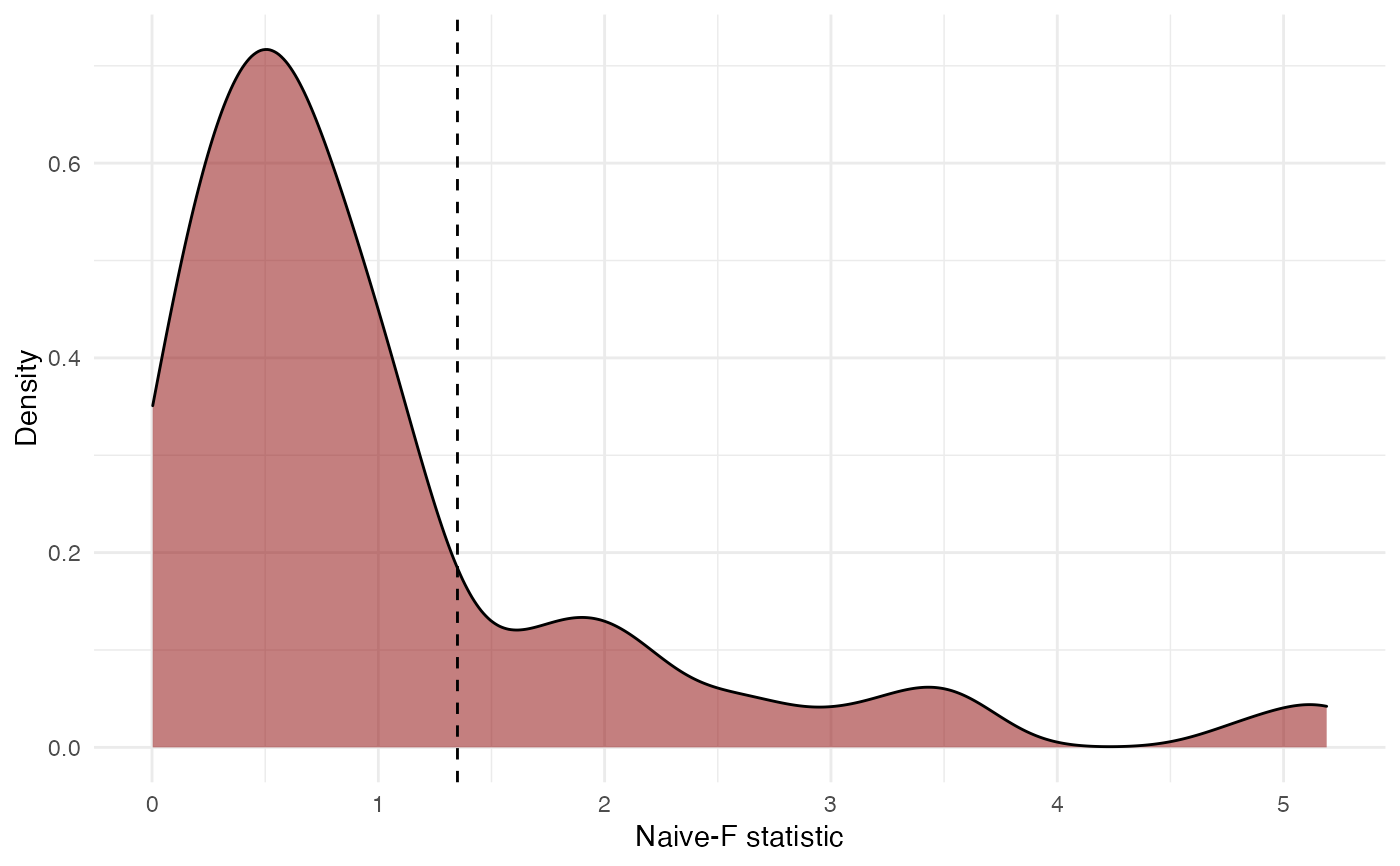
Creates a density plot showing the distribution of bootstrap test statistics.
Usage
# S3 method for class 'Wald_test_wildmeta'
plot(x, ...)
Arguments
- x
Results from Wald_test_cwb function
- ...
Any other arguments to be passed to
ggplot2::geom_density()
Examples
data("SATcoaching", package = "clubSandwich")
library(clubSandwich)
library(robumeta)

full_model <- robu(d ~ 0 + study_type + hrs + test,
                   studynum = study,
                   var.eff.size = V,
                   small = FALSE,
                   data = SATcoaching)


res <- Wald_test_cwb(full_model = full_model,
                     constraints = constrain_equal(1:3),
                     R = 99)

if (requireNamespace("ggplot2", quietly = TRUE)) {
plot(res, fill = "darkred", alpha = 0.5)
}